This project was created by a group of Facebook engineers back in 2008. It would be interesting to see what this would look like today! Have we mentioned we like data visualization?
Wednesday 29 February 2012
Tuesday 28 February 2012
The Making of House of Cards
James Frost directs Radiohead's House of Cards music video with Aaron Koblin.
The final video is a stunning example of integrating digital technology and data into an artistic portrayal of society and humanness. Using scanners as recording devices, the video is created entirely from data collected through the scanners as they register objects and people.
"In a way, it's a reflection of where we are in society. Everything around us is data. Everything around us is data driven in some way, shape or form. We're so reliant on it now. It seems like our lives are digital, and so in that sense, it [the video] seemed apt." James Frost, Director
Watch the video for a closer look.
Further Future Vision videos released on YouTube
The MicrosoftBI YouTube channel has posted several new videos in line with their 2011 Future Vision initiative.
The videos explore the possibilities of expanding real-time transactions and information sharing in several different business realms. Imagine the amount of data created! So many possibilities for visualization and analysis! How exciting!
For more information on the original 2011 clip, Geekwire discusses the Future Vision Video here.
Deep Into Big Data
This article by Divina Paredes discusses the role of Data Scientists and how new data handling technology is enabling different industries to improve the way they do business.
"...HSBC is now using SAS fraud management to protect all credit card transactions in real time. The solution runs at the point of transaction to decide whether that transaction is potentially fraudulent and runs analytical processes quickly. The shift is from fraud detection to fraud prevention, says Foster. The result is significantly lower incident of fraud across tens of millions of debit and credit card accounts, and improved detection rates and significant reduction in false positives..."
Read more on CIO here.
Monday 27 February 2012
Fun facts for data center geeks
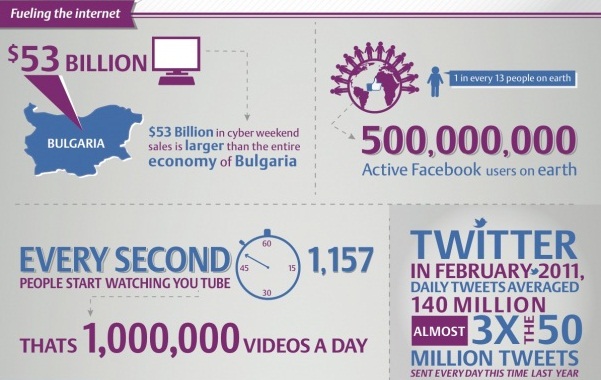
This lovely Infographic by Emerson Network Power combines our love of information data and preference for pretty pictures. Read Gigaom writer Barb Darrow's post and see the full infographic here. Information data thanks to Emerson’s State of the Data Center 2011 report.
This lovely Infographic by Emerson Network Power combines our love of information data and preference for pretty pictures. Read Gigaom writer Barb Darrow's post and see the full infographic here. Information data thanks to Emerson’s State of the Data Center 2011 report.
Sunday 26 February 2012
Thursday 23 February 2012
Super Graphics make sense of a sea of data with BIS² technology
sticK talks to BIS² about data visualization, business decision making and clever algorithms. Click on the image for the full low-down at sticknz.net.
sticK talks to BIS² about data visualization, business decision making and clever algorithms. Click on the image for the full low-down at sticknz.net.
Tuesday 21 February 2012
 Welcome to the BIS² Blog. We're a Data Visualization BI Software industry leader, and we're passionate about what we do.
 In this space we'll be looking at all aspects of data visualization and a variety of business intelligence tools, and of course – we'll be sharing the latest innovations in our specialist software.
If you would like more information about BIS² than we provide here, please feel free to visit our website at www.bis2.net.
If you have content that you'd like to contribute or would like to add a guest blog post, please email media@bis2.net with your ideas.
Subscribe to:
Posts (Atom)


